Does Your Customer Service Team Have a Turnover Problem?
Employee turnover is a constant worry for customer service managers.
This was a huge topic for ICMI's conference advisory board, a group that gives input on programming for ICMI's contact center conferences. I serve on the board and we recently had a planning call for the 2016 Contact Center Demo and Conference. A significant portion of the meeting focused on contact center attrition.
Individual customer service leaders have been sharing this concern with me too. It's also a hot topic on the Inside Customer Service LinkedIn group.
The challenge here is separating facts from feelings. Turnover feels bad, but the customer service profession generally experiences higher turnover than other industries.
Do you have the facts that tell you whether or not it's really a problem? And, if it is a problem, how big a problem is it?
I've put together this guide to help you find the answers to these questions.

Source: Chris Griffith
How to Calculate Employee Turnover
You can start by calculating your overall turnover rate using this formula for a particular time period (one year, one month, etc.):
Employee Separations / Active Employee Count = Turnover Rate
For example, let's say you had 40 employees leave and you have 100 active employees (on average) over the course of one year. Your turnover calculation would be:
40/100 = 40%
It's also helpful to calculate your bad turnover rate. Bad turnover is when an employee is either fired or quits the company entirely. Good turnover is when an employee leaves the job for another opportunity within the company, usually a promotion.
So, your bad turnover rate formula is this:
(Employee Terminations + Employee Quits) / Active Employee Count = Bad Turnover Rate
Let's say you had 40 employees leave, but 10 of them were promoted into other positions within the company, 5 were fired and 25 resigned voluntarily.
Your bad turnover rate calculation would be:
(5 + 25)/100 = 30%
Is Turnover a Problem?
Once you've calculated the turnover rate, it's time to find out if turnover is really a problem.
Keep in mind that nearly every customer service team will experience some employee turnover. What you really want to know is whether your team's turnover rate is normal. There's two ways you can look at this:
One option is to compare your current turnover rate to historical trends. For example, you might be concerned if this graph represented your team:
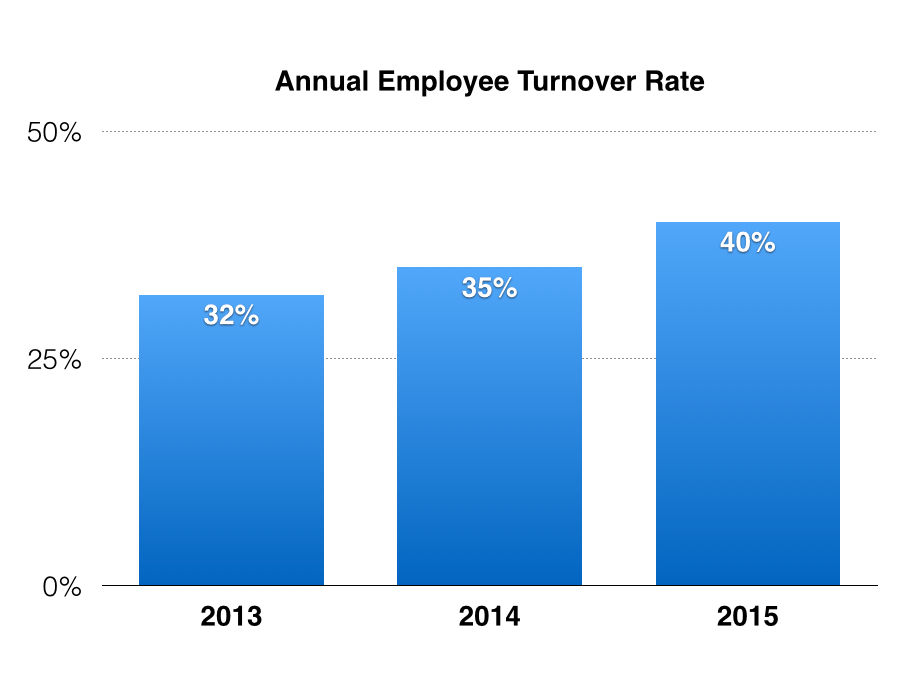
But wait! That graph just shows overall turnover. Let's see what happens when we separate good and bad turnover trends.

Here, it looks like bad turnover is relatively steady, but we're doing a better job of feeding talent into the company.
Another option is to compare your turnover rate to market averages. The tough part about this approach is good data can be hard to come by.
Industry associations sometimes publish this data based on member surveys, but it may or may not be region-specific. Your local chamber of commerce might publish this data, but it may or may not be industry-specific.
The other problem with these external benchmarks is they typically don't separate good turnover from bad turnover, so it's all lumped together.
Whatever benchmark you choose, it's fair to make some assumptions. The goal is to find a reasonable normal turnover rate that you can compare to your own turnover percentage.
You probably don't have much to worry about if your turnover rate is normal or below normal. If it's above normal, I recommend setting a goal for improvement based on the difference.
Like this:
Current bad turnover rate: 30%
Normal bad turnover rate: 20%
Goal: Reduce bad turnover by 33% (down to 20%).
Is Turnover a Costly Problem?
High turnover seems bad, but it's important to determine how much it's really costing you. Putting real dollars and cents on the issue will help you make the business case for any necessary improvements.
You can use this turnover cost spreadsheet to calculate the true cost. The spreadsheet looks at many expenses associated with turnover:
Training costs
Hiring costs
OT costs due to short-staffing
There's a section there for both hard and soft costs, but I recommend focusing on hard costs. Using real dollars has much more credibility with executives.
My suggestion is to run two calculations:
Calculate your current bad turnover cost
Calculate what your turnover cost would be if your bad turnover rate was normal
The difference between the two calculations is your potential savings from improving turnover to a normal rate.
Here's an example:
Let's say your turnover cost is $4,200 per employee. Here are the two calculations at 30 percent (present rate) and 20 percent (normal rate):
$4,200 x 30 = $126,000/yr
$4,200 x 20 = $84,000/yr
So, $126,000 - $84,000 = $42,000
This means you could save $42,000 per year just by lowering your bad turnover rate to a normal level. That's probably a figure that would get your boss's attention.
So, how do you reduce turnover?
I'll cover some ideas in a post next week. If you aren't already, you can subscribe via email so you won't miss a post.