
A customer calls your company for service. After the call, they get an email asking them to complete a survey. The survey is intended to evaluate overall customer service and the individual rep's performance.
A host of problems hurt that mission.
Response rates are too low
Survey scores are notoriously inflated
Reps get blamed for factors outside of their control
A new metric called the sentiment arc can solve those problems and eliminate annoying surveys. It works by tapping into your existing data to answer a fundamental question:
Is the customer happier at the end of the contact than they were at the beginning?
I partnered with Balto, a contact center agent support software provider, to test this metric by analyzing aggregated data from over 29,000 de-identified customer service phone calls made to a home improvement company.
The anonymous data revealed some surprising conclusions about how customers really feel about the service they receive, and what the best reps do to achieve better outcomes.
In this post, I’ll show you:

What is the customer service sentiment arc?
A sentiment arc is defined as the change in emotion over time.
Unlike a survey that only measures customer satisfaction after a contact, the sentiment arc measures the change in customer satisfaction over the course of a contact.
This helps evaluate the specific impact the customer service rep had on the interaction. The rep clearly had a positive impact if the customer is happier at the end of the interaction than they were at the beginning.
How is the sentiment arc evaluated?
The sentiment arc is evaluated by gauging a customer’s emotions at the start of a contact and comparing them to the customer’s emotions at the end of the contact.
For our test, Balto's software identified the words customers used during the first 30 seconds of the call. A deep learning model then evaluated each customer's starting sentiment.
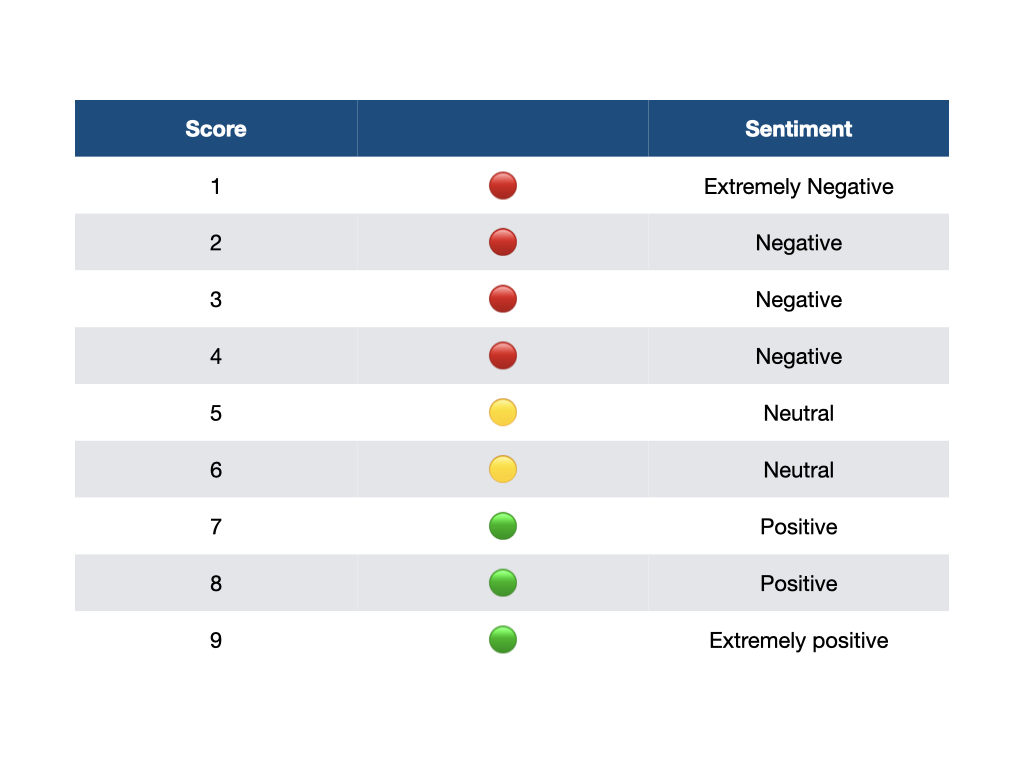
Sentiment was evaluated on a scale of 1-9, with "1" being extremely negative, "5" being neutral, and "9" being extremely positive.
Customer sentiment was calculated again at the end of the call using a similar process.
This data helped us identify two things:
How did sentiment change over the course of the call?
What did agents do to increase (or decrease) sentiment?
What did the sentiment arc reveal?
The sentiment arc revealed a number of advantages over a traditional customer service survey. It also identified what successful agents did well.
Unlike a survey where just 5 percent of customers might respond, Balto was able to analyze the sentiment arc for nearly 100% of the calls tested. The analysis provided a much more granular view of customer sentiment than a survey might reveal.
Finding 1: Most customer interactions are neutral
The vast majority of customer service calls to the home improvement company ended with neutral sentiment. Customers were just fine with the service they received.

Traditional surveys make it difficult to tell the difference between truly happy customers and people who are merely satisfied.
These surveys ask customers to rate their satisfaction after an interaction. "Satisfied" is essentially neutral, so customers often give a top rating when everything is just fine.
Survey respondents also tend to be selective. People who complete these surveys are either generally happy or they're furious. This can further skew the results.
The sentiment score provides some more granular insight. When you plot out the data, it shows few customers experience emotional extremes.

Finding 2: Agents are usually helpful
Customer service reps are supposed to help customers have a better experience. One way to gauge that is by measuring whether sentiment improved over the course of a call.
Here, the home improvement company’s reps did very well. An impressive 46 percent of calls ended with higher sentiment than they started. Sentiment decreased on fewer than 1 percent of calls.

Drilling down a bit, the sentiment arc reveals exactly how much sentiment improved over the course of a call.

When sentiment improved, it often improved just one point on the nine point scale.
This provides a more realistic picture of agent contribution than a traditional survey where a satisfied customer might give a top score simply because there was nothing wrong with the interaction.
Another limitation of traditional surveys is they can unfairly punish agents. A three rating on a five-point scale might be viewed as a failure under this system. The assumption is that the rep must have done something wrong to earn a three.
The sentiment arc provides a new perspective. In our test, reps improved customer sentiment on nearly 40 percent calls that ended neutral.

Customers are sometimes frustrated by an issue that's beyond the rep's ability to solve. The rep might lack the resources or authority to make the customer happy. Here, a poor survey score is a reflection of an unfortunate situation rather than the rep's ability to serve.
Tracking the sentiment arc makes this easier to see.
The home improvement company's customer service reps were true miracle workers when the call started off on the wrong foot. Calls that started with negative sentiment almost always ended better.

Finding 3: Proactive reps improve sentiment
One of our goals was to identify specific actions reps can take to improve sentiment. Improvement was tightly correlated with two things:
Agents asking more questions
Agents talking more than the customer
Let's start with agents asking more questions. Sentiment tended to improve when agents asked more questions per call.

Questions are a good proxy for active listening. Reps who do a good job listening to customers tend to diagnose issues faster and with more accuracy. That, in turn, puts customers at ease and makes them happier with the outcome.
The second trend was surprising. Agents got better results when they talked more than their customers.

This seems counterintuitive at first. Isn't talking more the opposite of listening? Here, it helps to think of a call in two parts.
Part one is where the customer explains the issue they are calling about. The most effective agents use active listening skills to quickly diagnose the customer's needs.
Part two is where the rep solves the issue and communicates the solution to the customer. It's natural for an agent to do more talking during this part of the call.
Both of these skills are examples of call control.
Call control is a process for proactively guiding customers through a call towards a successful resolution. It requires agents to listen carefully to customers' needs, quickly diagnose the issue, and expertly solve the problem.
This short video can help you improve your call control skills:
How can you implement the sentiment arc?
Try running an experiment to see if the sentiment arc can replace your customer service survey. There are two ways you can run this test.
The first is by using your existing sentiment analysis tool. Companies like Balto can provide sentiment data on each call. You can use the built-in BaltoGPT feature to answer questions about change in sentiment.
What if you don't have a sentiment analysis tool?
The low-tech alternative is to use your existing quality assurance (QA) process. Ask your QA technicians to evaluate starting and ending sentiment.
You might want to use a 1-5 scale to make it easier to manually score:
= extremely negative sentiment
= somewhat negative sentiment
= neutral sentiment
= someone positive sentiment
= extremely positive sentiment
Run an analysis once you've gathered your data. Try to answer these questions:
How does your ending sentiment score compare to your customer service survey?
What is your sentiment arc score? (percentage of calls where sentiment improves)
What agent behaviors drive sentiment improvement?
Resources to get you started
LinkedIn Learning subscribers can use my Phone-Based Customer Service course to build the skills necessary to serve customers over the phone.